Machine Learning - Helping world to do statistical analysis
In today’s fast growing world, statistical analysis and forecasting the market trend is very important to take any business decision. Doing statistical analysis manually will be too tedious. Also, accuracy is very important in this and manual analysis can be error-prone.
In this era of technology, this analysis ain't difficult. How about giving data to a machine and then expecting an output that would show us the required analysis?
Here is how technology helps us to understand the market trends.
Here is how technology helps us to understand the market trends.
One of the ways of doing statistical analysis is Linear regression, wherein there is a linear relationship between a dependent variable and one or more independent variables. It can be Simple Linear Regression (1 dependent variable and 1 independent variable) or Multiple Linear Regression (1 dependent variable and more than one independent variables)
What are these dependent and independent variables?
Independent variables are inputs given to the machine and dependent variables are the output resulting from these inputs. As the name goes, linear regression, that means the output (dependent variables) is dependent linearly on the input data(Independent variables).
To understand this relationship of dependent and independent variables, let's consider a case study.
Our data is now in the numeric form. But the data is in varied form and needs to be scaled between some values. Thus we use Feature Scaling to normalize the data between specific ranges.
Now we are ready to build our model and plot our linear graph. The y_train will be Result variable and X_train will have Predictor variables.
The feature used here will be Recursive Feature Elimination and Manual feature reduction which will determine us with the best predictor variables. These values will have a rank and the values with rank 1 will be considered for building the model.
We now remove the unwanted values to simplify the model. Only values ranked with ! will be considered by the model.
Here, R-squared, Adj R-squared, F-statistic and VIF are some values that we need to look into. The R-squared and Adj R-squared should be between 0 and 1, F-statistic should have max values and VIF should have value less than 5 to reduce the correlation between the parameters. The parameters having more than 5 should be removed.
Our graph of linear regression will look as follows. Here the y-axis contains price and X-axis contains the predictor variables. The parameters which will now be present are the parameters on which the price of the car will be dependent on.
Thus with the help of Linear regression method, the car company will understand the market trend and the parameters affecting the price.

What are these dependent and independent variables?
Independent variables are inputs given to the machine and dependent variables are the output resulting from these inputs. As the name goes, linear regression, that means the output (dependent variables) is dependent linearly on the input data(Independent variables).
To understand this relationship of dependent and independent variables, let's consider a case study.
A car company aspires to start its production unit off shores. But it needs to know about the local production and manufacturing prices so that they can offer their customer with a lesser price. They need to know what are the factors that affect the pricing of a car, ie, these factors are the independent variables and price is the dependent variable.
The data present with us contain information like Car name, fuel type, engine door number, height, etc.
Now, how will our machine use this data to know the trends?
Our machine will be trained in such a way that it gives us the best results.
We will divide the data into two parts - training data(70%) and testing data(30%).
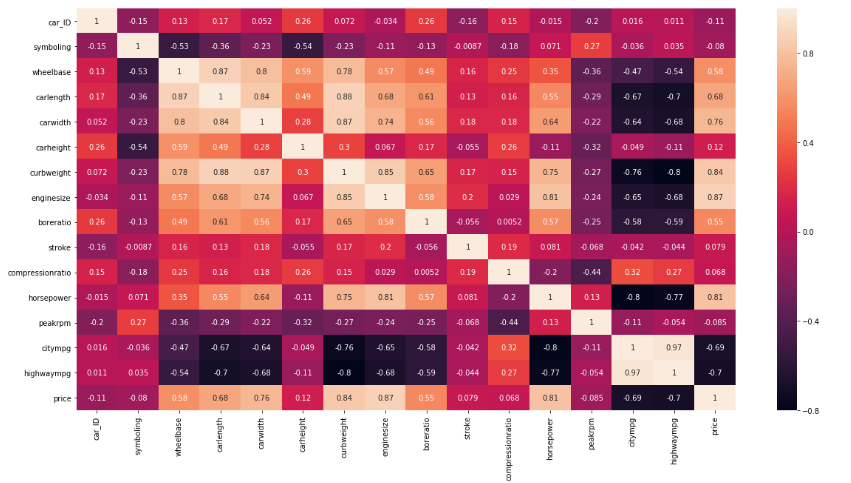
Machine does not understand characters but it understands numeric data only. Thus, the data must be converted into numeric values by various methods for the machine to understand. First, classify the data based on this criteria. Now calculate the min value, max value, mean deviation etc from the data so that we understand that is present in the data. This calculated value won't have the characters but will contain only numeric values, i.e, door number, height, engine size etc. Now, a Heat map is plotted to understand the correlation between these values. In a negative correlation, the variables are inversely proportional and in positive correlation, they are directly proportional. This map helps us to understand the correlation between the values. The correlation between the same values will always be one.
Now, let's take a look at our charactorial data. These charactorial values can be error prone hence we need to classify it properly and include all the possible mistakes in it. For e.g, Toyota may be misspelled as toyouta or toyota. These iterations must be included as well.
For the values having only two values, consider one value as 0 and other as 1. For e.g, consider fuel values having gas and diesel so one value will be 0 and 1. We converted this data into binary values.
For the values having more than two values, consider the true value as 1 and others as 0. These are called dummy integers.
The data present with us contain information like Car name, fuel type, engine door number, height, etc.
Now, how will our machine use this data to know the trends?
Our machine will be trained in such a way that it gives us the best results.
We will divide the data into two parts - training data(70%) and testing data(30%).
Machine does not understand characters but it understands numeric data only. Thus, the data must be converted into numeric values by various methods for the machine to understand. First, classify the data based on this criteria. Now calculate the min value, max value, mean deviation etc from the data so that we understand that is present in the data. This calculated value won't have the characters but will contain only numeric values, i.e, door number, height, engine size etc. Now, a Heat map is plotted to understand the correlation between these values. In a negative correlation, the variables are inversely proportional and in positive correlation, they are directly proportional. This map helps us to understand the correlation between the values. The correlation between the same values will always be one.
Now, let's take a look at our charactorial data. These charactorial values can be error prone hence we need to classify it properly and include all the possible mistakes in it. For e.g, Toyota may be misspelled as toyouta or toyota. These iterations must be included as well.
For the values having only two values, consider one value as 0 and other as 1. For e.g, consider fuel values having gas and diesel so one value will be 0 and 1. We converted this data into binary values.
For the values having more than two values, consider the true value as 1 and others as 0. These are called dummy integers.
Our data is now in the numeric form. But the data is in varied form and needs to be scaled between some values. Thus we use Feature Scaling to normalize the data between specific ranges.
Now we are ready to build our model and plot our linear graph. The y_train will be Result variable and X_train will have Predictor variables.
The feature used here will be Recursive Feature Elimination and Manual feature reduction which will determine us with the best predictor variables. These values will have a rank and the values with rank 1 will be considered for building the model.
We now remove the unwanted values to simplify the model. Only values ranked with ! will be considered by the model.
Here, R-squared, Adj R-squared, F-statistic and VIF are some values that we need to look into. The R-squared and Adj R-squared should be between 0 and 1, F-statistic should have max values and VIF should have value less than 5 to reduce the correlation between the parameters. The parameters having more than 5 should be removed.
Our graph of linear regression will look as follows. Here the y-axis contains price and X-axis contains the predictor variables. The parameters which will now be present are the parameters on which the price of the car will be dependent on.
Thus with the help of Linear regression method, the car company will understand the market trend and the parameters affecting the price.
You've explained such an unintelligible topic ,impressed with your writing skills. Keep going 💪
ReplyDeleteWow. You gave such a wonderful insight into the world of Machine learning. Noiceee
ReplyDeleteGreat!
ReplyDeleteThe topic is elaborated in a very simple and understanding manner.
Waiting to read more of it from you!